
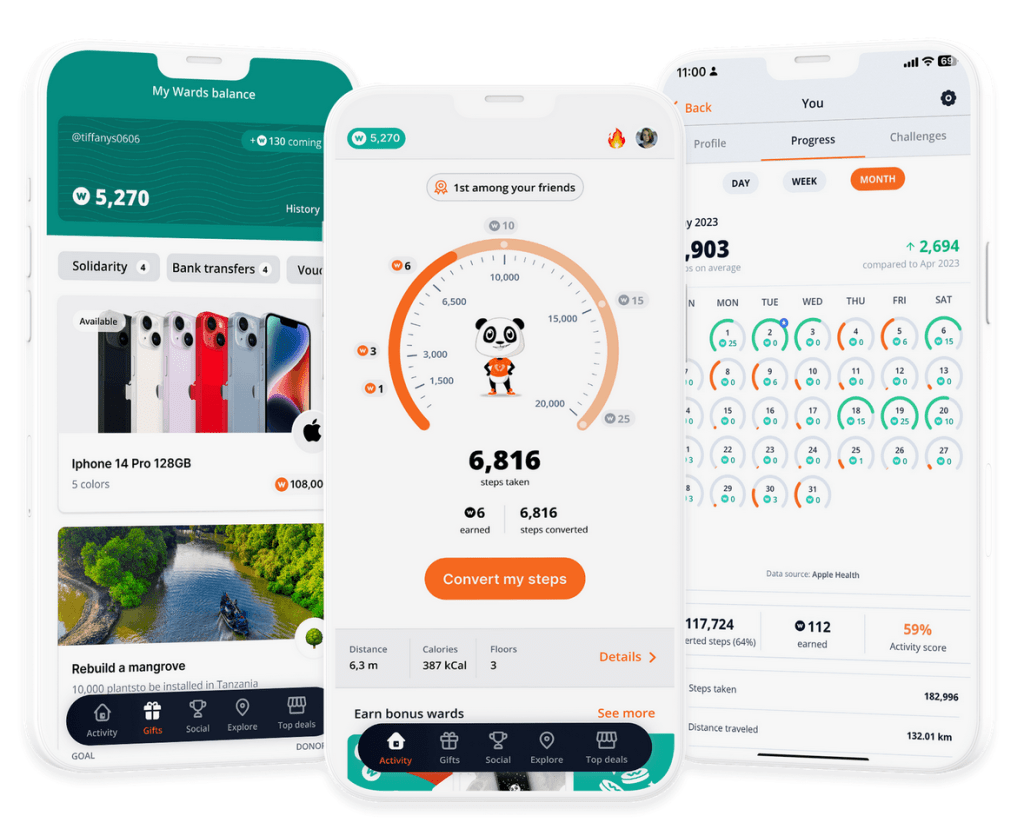
A Real Reason to Walk

Premise: The popular European walking rewards app, WeWard is looking to break into the US market.
Question: How many “Wards” (reward points) are distributed on a monthly basis?
Methedology
- Identify all “Ward” sources
- Calculate the number of Wards per source based on an assumed user base.
- 6,000,000 MAU
- 3,000,000 DAU
- Report findings and take into account the elevated step count for the average WeWard user.
“Ward” Sources
- Walking (pedometer)
- Achievements
- Games (Play to Earn)
- Surveys
- Top Deals (Purchases made using affiliate links)
- Exploration (Points of Interest Check-Ins)
Walking
Summary
The number of Wards earned by country from walking is an effective way to breakdown the source, rough distance walked, and magnitude of Wards earned from each region.
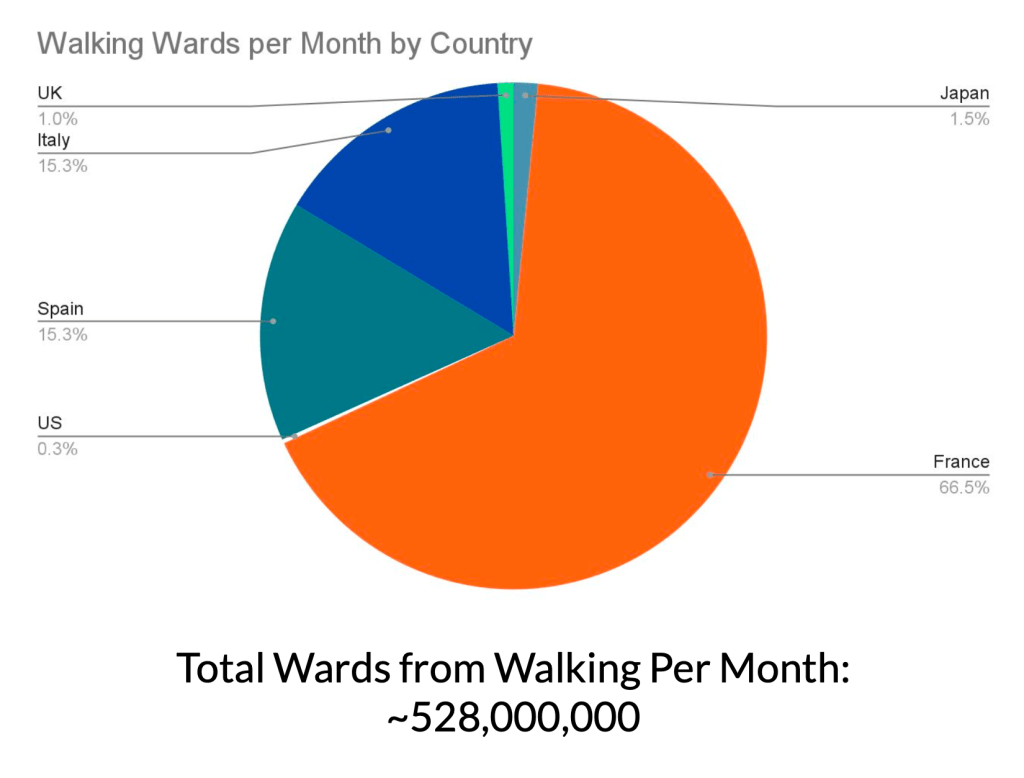
Additional Takeaways:
- The number of Wards earned from walking are mainly generated in France.
- Other major contributors are Italy and Spain.
Daily Steps By Country:
- Calculate the average number of steps per country
- Context:
- The average steps vary by country
- The number of users per country vary greatly
- +24% Steps for WeWard users.
- Context:
- Map these step counts to the applicable Ward thresholds
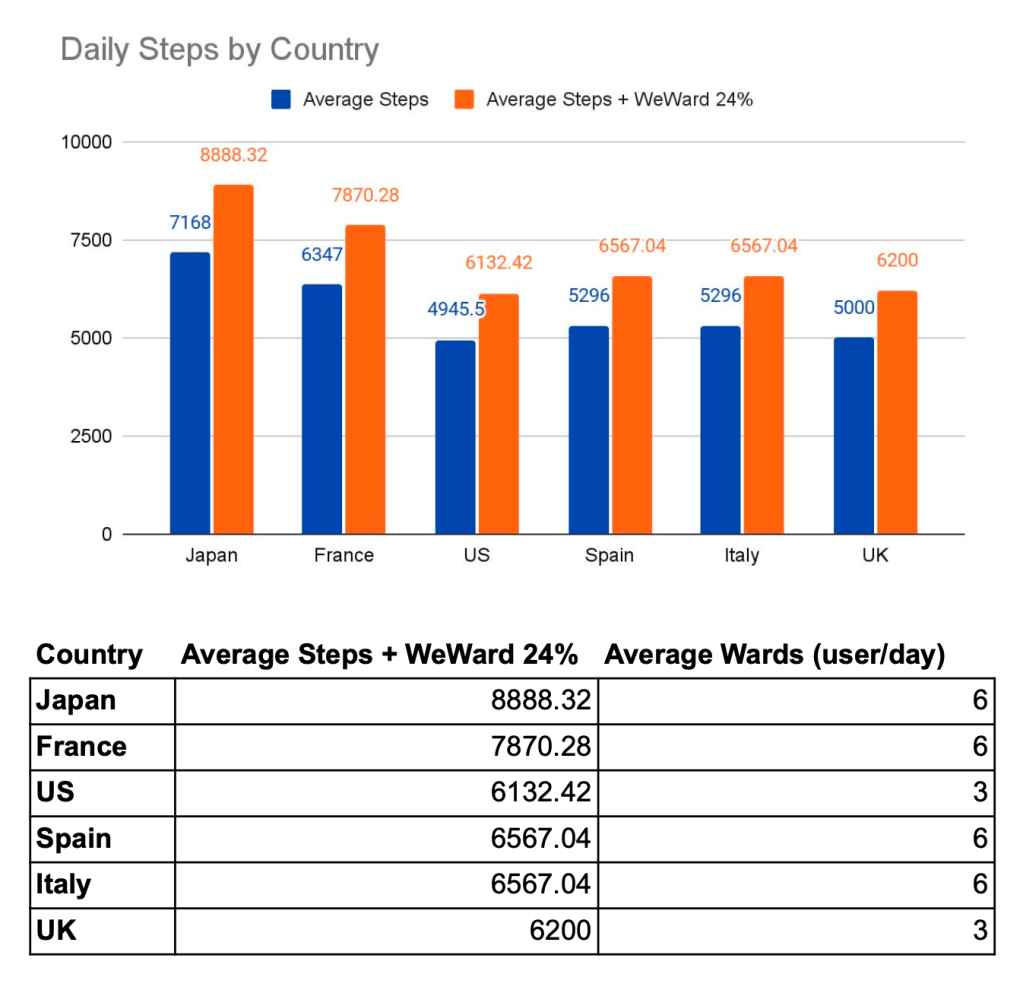
Additional Context: Researching the number of steps walked by country, I was able to find additional context sources which gave me the rough step count values.
Users by Country
The number of WeWard users per country greatly impacts the number of Wards allocated.
Additional Context:
WeWard DAU: 3,000,000
Reviewing the WeWard usage on tools like SensorTower
- France, Italy, & Spain have the highest usage and app store ranking
- Japan, United Kingdom, & US rankings were much lower.
Conclusion: the number of WeWard users is heavily weighted toward France, Spain, and Italy.

Monthly Wards Generated from Walking

Total Wards from Walking: ~528,000,000
Assumptions:
- The average number of steps per country holds true to WeWard users
- Results are based off of 3M DAU instead of 6M MAU as to get a closer count to the actual Wards distributed.
Caveat: The number of Wards from walking per month is likely on the conservative side.
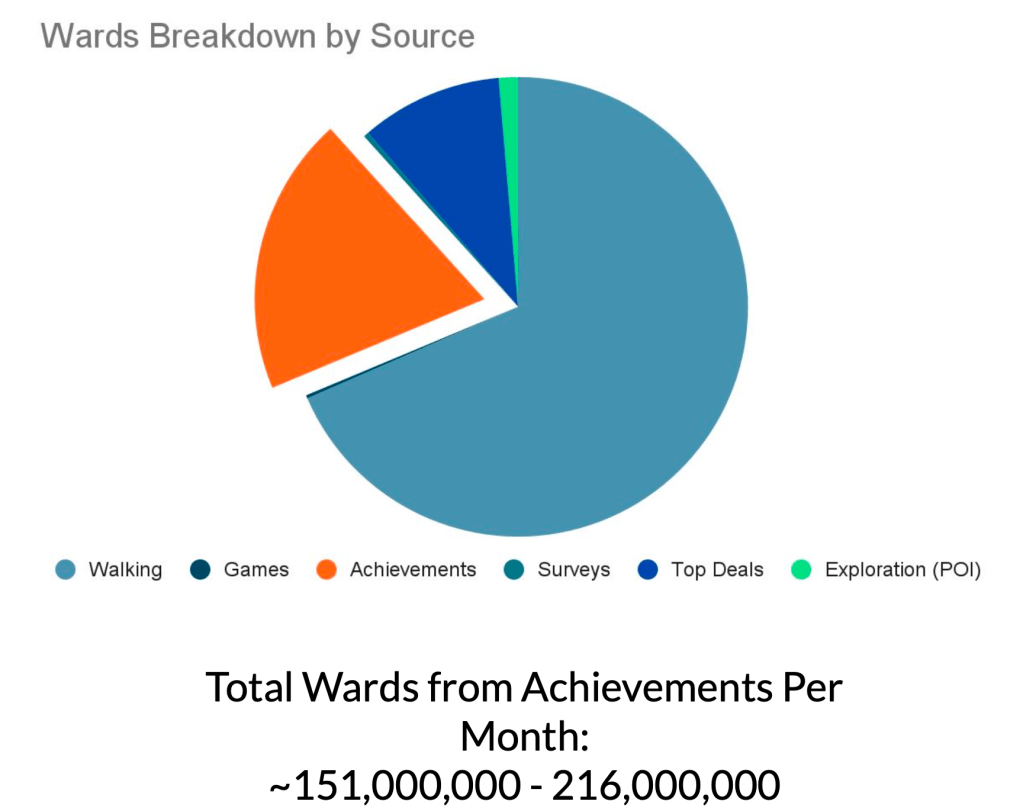
Achievements
Summary
The number of Wards earned per user from Achievements are likely a large contributing factor to the overall Monthly Wards.
- Caveats:
- 1. The number of Wards granted may vary greatly depending on the Achievement structure
- 2. Due to limited Achievement access the Achievement Ward count may be skewed.
Wards Generated by Achievements per Month
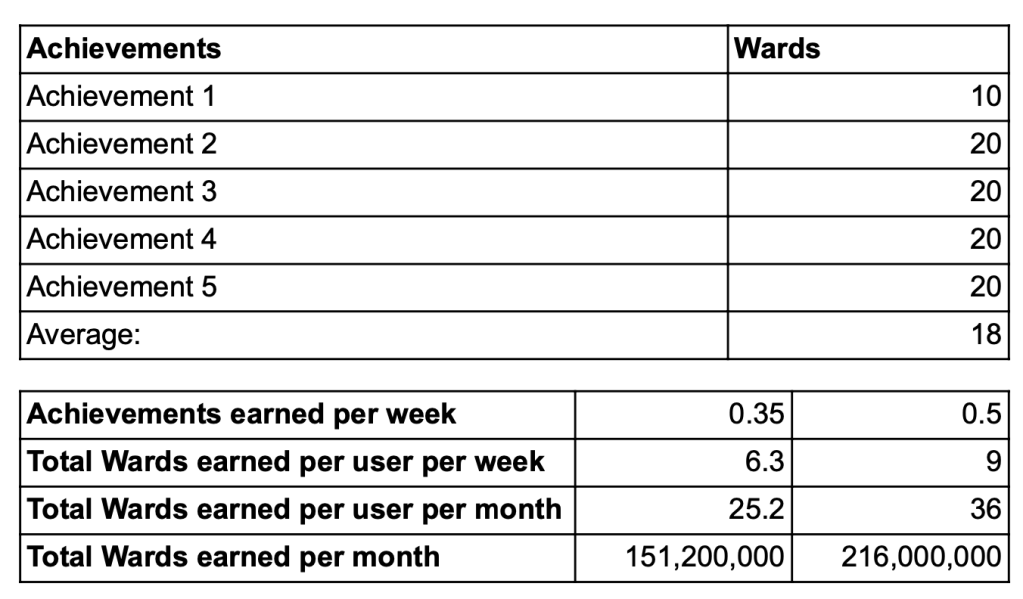
- Taking into account
- The number of Achievements available
- The number of Wards awarded per achievement
- And the amount of engagement with Achievements by top tier players
- The number of estimated Wards provided from Achievements on a monthly basis is between 151,200,000 – 216,000,000
- Assumptions:
- After reviewing top scoring user’s (Social Leaderboard) achievement levels, it became clear that engagement with Achievements may be lower than anticipated.
Games & Surveys
Summary
Games and Surveys are likely one of the smallest contributing sources to the overall monthly Wards allocations.
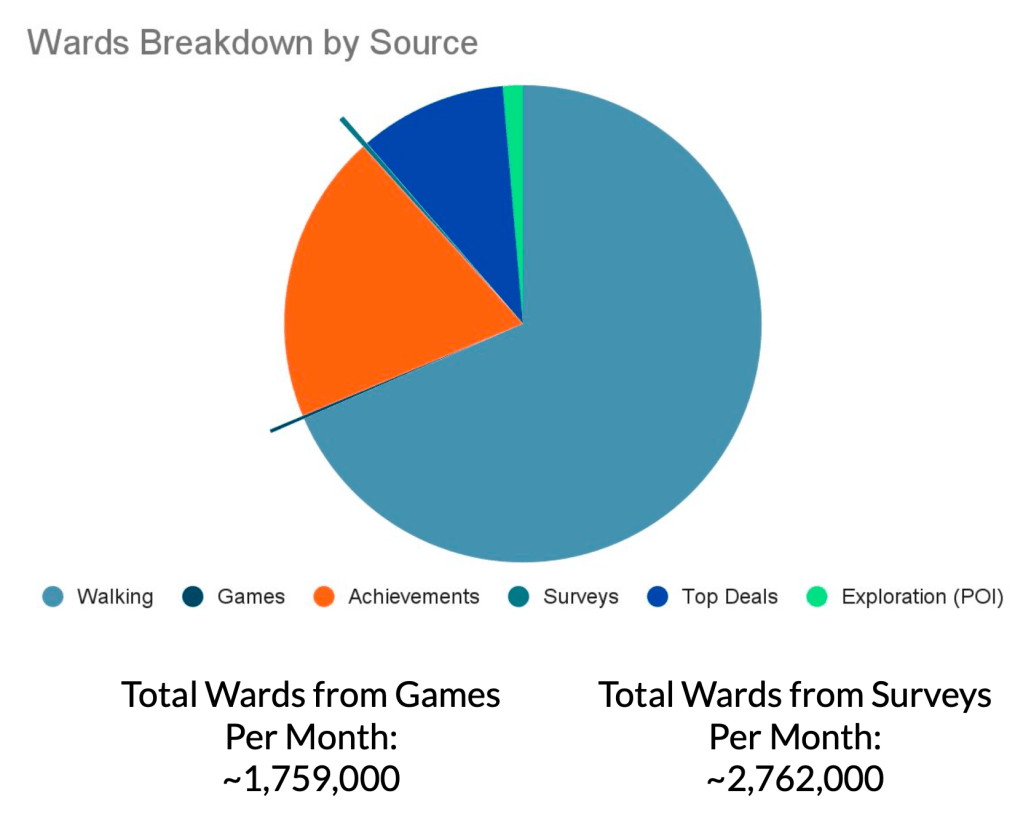
Overview:
- Adding the number of Wards mentioned in-app earned by games by week and extrapolating this to a month timeframe:
- Monthly Game Wards total of: ~1,759,584
- Conducting the same process for Surveys:
- Monthly Survey Wards total of: ~2,762,204
- Assumptions:
- The Games and Survey “Wards awarded this week” are accurate and on a 7 day calendar.
- Caveats:
- The number of “Wards awarded this week” pictured in-app is likely an evolving value as such these estimates may be off.
- The timeframe for “Wards awarded this week” is unclear and may be a rolling timeframe which may skew the true numbers.
Top Deals
Summary
The Top Deals section may be a large contributor to the number of Wards distributed each month, even with a relatively low engagement rate of 2%–4%.
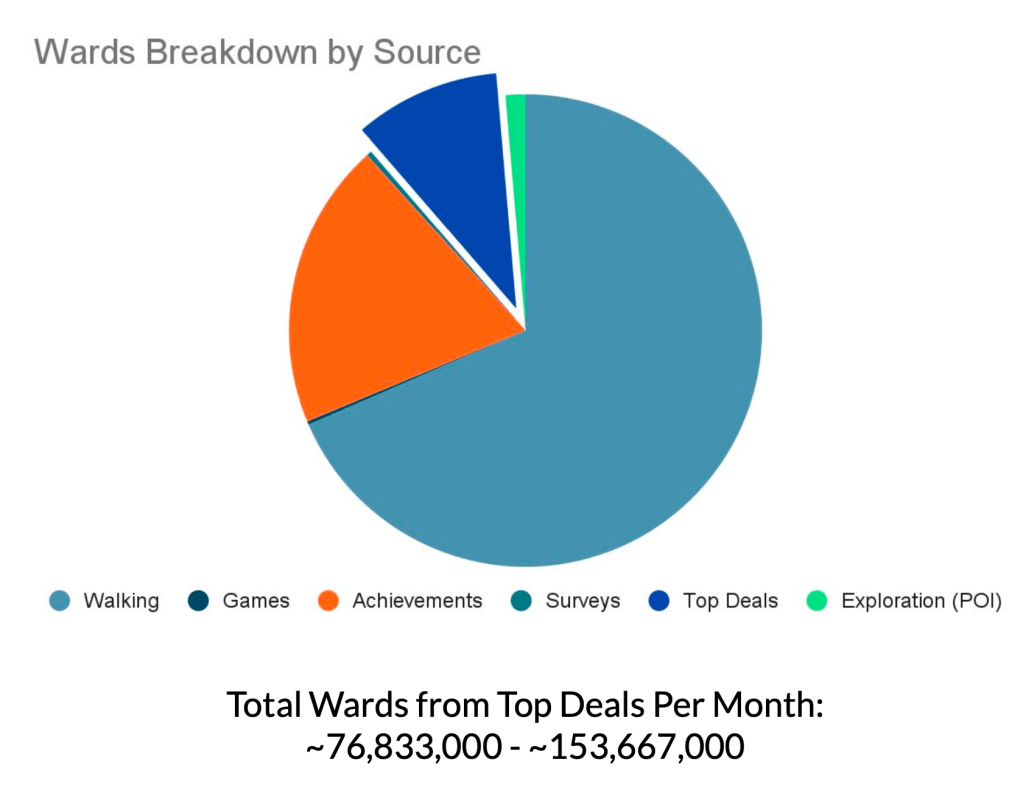
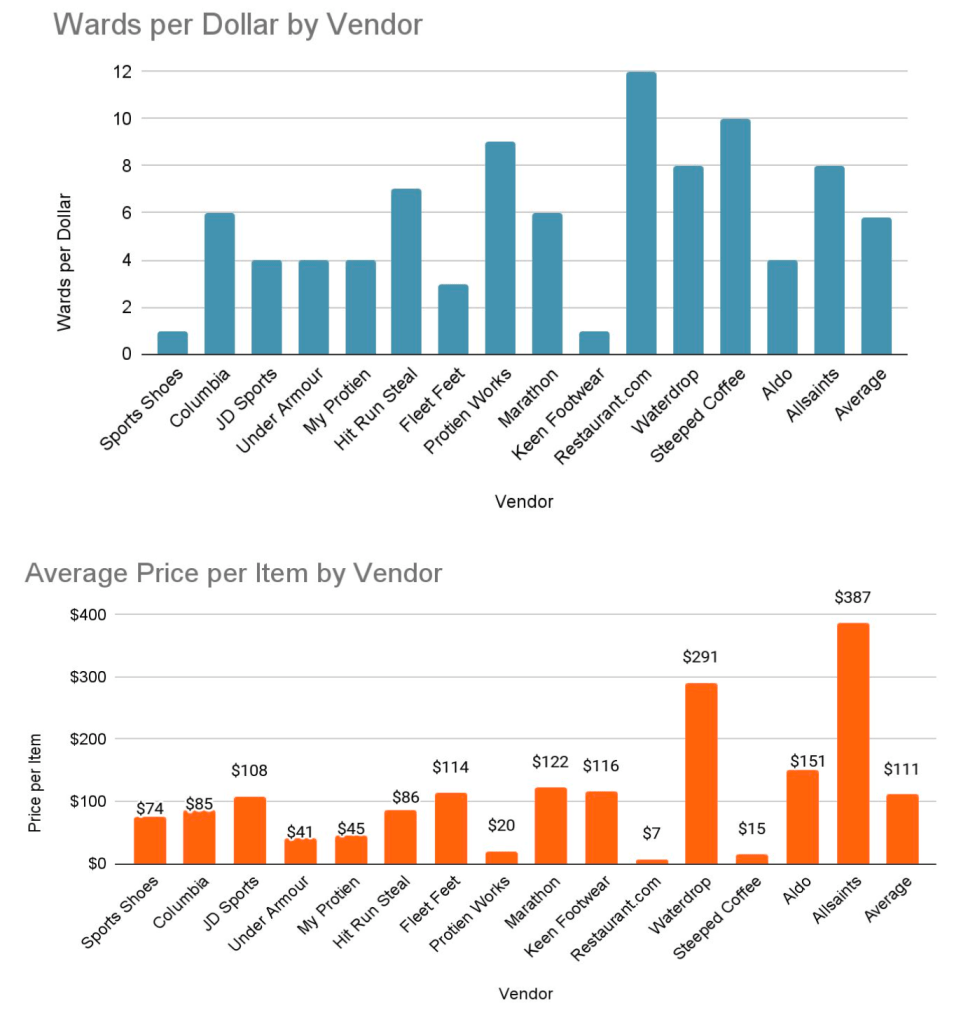
Monthly Top Deals Wards
- The number of Wards awarded per dollar spend varies from vendor to vendor.
- This coupled with the Average Item cost per vendor makes calculating this value complex.
- After auditing the Top Deals section and finding the average item price for several vendors
Results: The Average number of Wards per purchase came to 640.
- Formula:
- (640 Wards x 6M MAU) x 2% engagement rate = 76,833,636 Monthly Wards
- (640 Wards x 6M MAU) x 4% engagement rate = 153,667,273 Monthly Wards

- Assumptions:
- The number of users who engage with the Top Deals section is very low due to the high barrier of entry
- The number of Wards per dollar can be impactful even with a lower engagement rate.
- The purchases made within the Top Deals section are evenly distributed among the available vendors.
- Caveats: Due to the array of Vendors and the varying Wards per Dollar offers the final Wards per Month calculation may be skewed.
Exploration
The Exploration section is one of the most curious sections for earning Wards as there is little indication of how often users engage with this section.
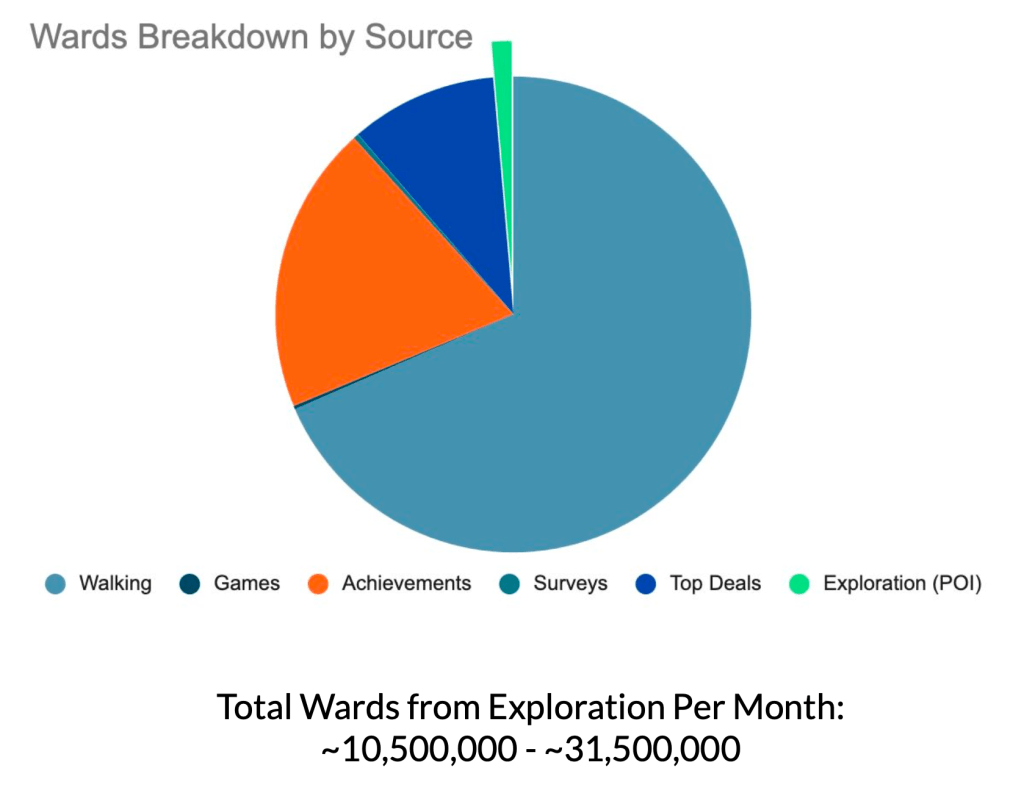
- Summary:
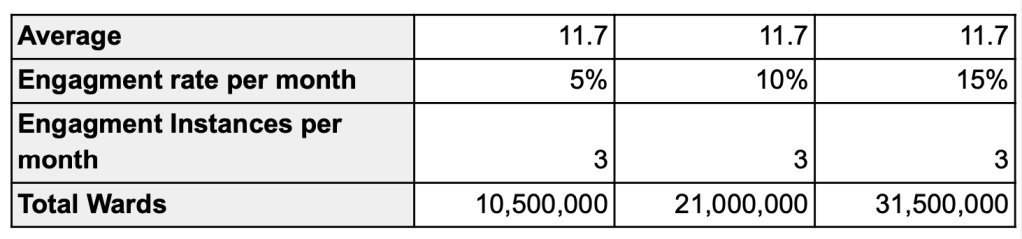
- The available NYC Exploration check-in locations offers range from 5 – 15 Wards per stop.
- Finding the Average Wards per Exploration check-in of 11.7
- Assumptions:
- The average engagement rate with this feature is between 5% – 15%.
- The users which engage with this feature likely engage with it multiple times a month.
- The engagement with the social proof prompt required on some check-ins may lower engagement rate.
Conclusion
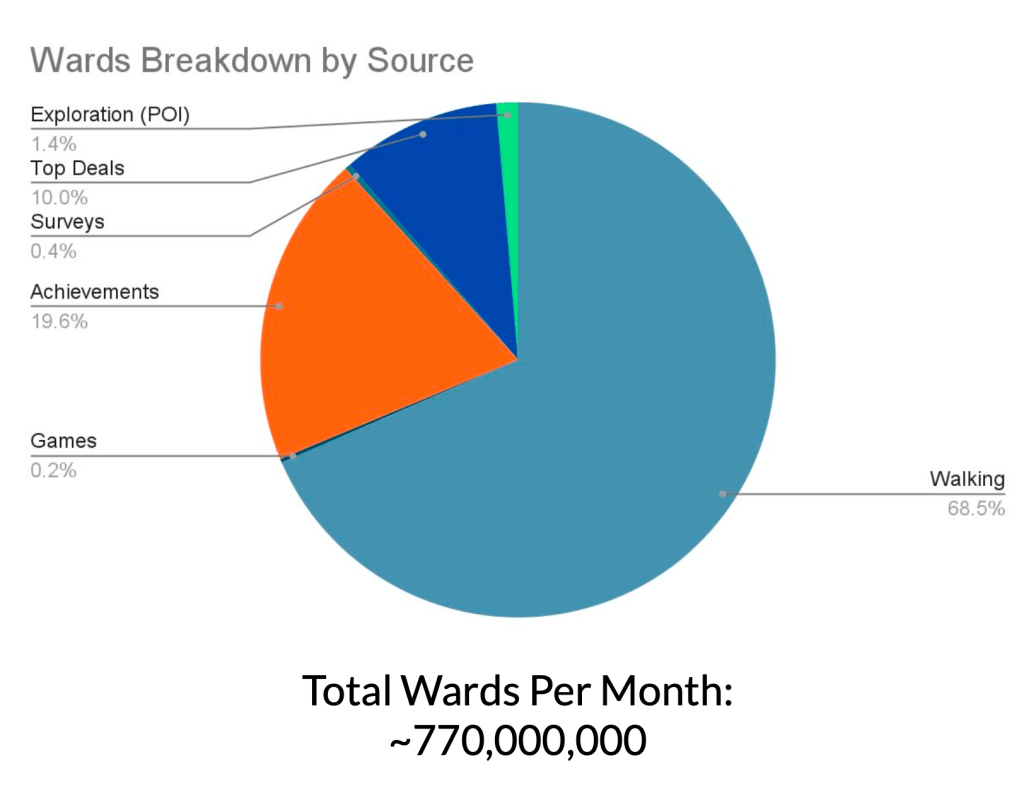
Total Wards Per Month: ~770,000,000
